Logstash in Kubernetes
April 13, 2024
Using Logstash in a Kubernetes environment can significantly enhance your ability to process and analyze logs generated by your containers and applications. Kubernetes, with its dynamic and distributed nature, produces logs that are crucial for monitoring the health and performance of your applications. Integrating Logstash into your Kubernetes cluster allows you to efficiently collect, transform, and forward these logs to a centralized logging solution like Elasticsearch.

Prerequisites
- A running Kubernetes cluster.
kubectlinstalled and configured to communicate with your cluster.- Basic familiarity with Kubernetes concepts like pods, deployments, and ConfigMaps.
Step 1: Create a Logstash Configuration
First, you need to define your Logstash configuration. This involves specifying the input, filter, and output sections of your Logstash pipeline. For Kubernetes, a common approach is to collect logs using a file or container log input, process them as needed, and then send them to Elasticsearch.
Save the following Logstash configuration as logstash-configmap.yaml. This example configuration collects logs from a file path (which will be mounted from Kubernetes logs) and outputs them to stdout for demonstration purposes. In a real-world scenario, you'd output to Elasticsearch or another log management solution. This configuration uses the grok filter to parse Nginx access logs and outputs to Elasticsearch.
apiVersion: v1
kind: ConfigMap
metadata:
  name: logstash-config
data:
  logstash.yml: |
    input {
      file {
        path => "/usr/share/logstash/logs/nginx-access.log"
        start_position => "beginning"
        sincedb_path => "/dev/null"
      }
    }
    filter {
      grok {
        match => { "message" => "%{COMBINEDAPACHELOG}" }
      }
    }
    output {
      elasticsearch {
        hosts => ["http://elasticsearch:9200"]
        index => "nginx-logs-%{+YYYY.MM.dd}"
      }
    }
This configuration is basic and intended for demonstration. Adjust the input and output to suit your specific logging architecture and requirements. In the hosts field under output.elasticsearch, replace "http://elasticsearch:9200" with your actual Elasticsearch service URL.
Step 2: Deploy Logstash in Kubernetes
Next, you'll deploy Logstash in your Kubernetes cluster using a deployment configuration. You'll reference the ConfigMap created in the previous step to provide Logstash with its configuration.
Create a file named logstash-deployment.yaml with the following content:
apiVersion: apps/v1
kind: Deployment
metadata:
  name: logstash
spec:
  replicas: 1
  selector:
    matchLabels:
      app: logstash
  template:
    metadata:
      labels:
        app: logstash
    spec:
      containers:
      - name: logstash
        image: docker.elastic.co/logstash/logstash:7.9.3
        volumeMounts:
        - name: config-volume
          mountPath: /usr/share/logstash/config/logstash.yml
          subPath: logstash.yml
        - name: log-volume
          mountPath: /usr/share/logstash/logs
      volumes:
      - name: config-volume
        configMap:
          name: logstash-config
      - name: log-volume
        emptyDir: {}
---
apiVersion: v1
kind: Pod
metadata:
  name: log-copier
spec:
  containers:
  - name: log-copier
    image: busybox
    command: ["/bin/sh"]
    args: ["-c", "while true; do cp /var/log/nginx/access.log /logs/nginx-access.log; sleep 10; done"]
    volumeMounts:
    - name: log-volume
      mountPath: /logs
  volumes:
  - name: log-volume
    emptyDir: {}
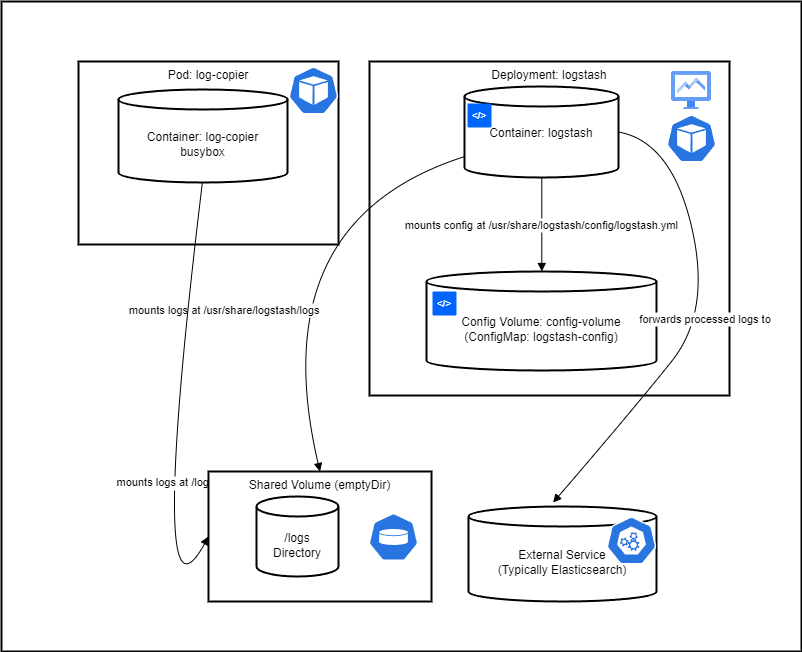
This deployment creates a Logstash pod, mounts the configuration from the ConfigMap, and also mounts a volume (/var/log/your-application) where your application logs are stored. You need to adjust the hostPath to the location of your Kubernetes application logs. This deployment sets up Logstash and a helper pod, log-copier, which simulates log file updates by copying Nginx access logs to the shared volume. Replace /var/log/nginx/access.log with the actual path to your Nginx access logs.
Step 3: Apply the Configuration
Apply the ConfigMap and Deployment to your Kubernetes cluster:
kubectl apply -f logstash-configmap.yaml
kubectl apply -f logstash-deployment.yaml
Step 4: Verify Deployment
Check the status of your deployment:
kubectl get pods -l app=logstash
View logs from the Logstash pod to ensure it's processing logs correctly:
kubectl logs -f <logstash-pod-name>
Collecting Logs
The path /usr/share/logstash/logs/nginx-access.log in the Logstash configuration is used to specify where Logstash expects to find the log files it should process. This specific path is part of the container's filesystem where Logstash runs, not the host machine's filesystem. Here's why this approach is taken, especially in a Kubernetes context:
-
Isolation: Running Logstash in a containerized environment like Kubernetes means working within isolated filesystems. Logstash, running inside its container, has its own separate filesystem from the host and other containers. By specifying a path like
/usr/share/logstash/logs/nginx-access.log, you're pointing Logstash to a location within its container's filesystem where it expects to find log files. -
Volume Mounts: Kubernetes allows you to mount volumes into containers. This mechanism is used to share data between containers and between the host and containers. In the example setup, a shared volume (like
emptyDiror a more persistent option depending on your requirements) is mounted into both the Logstash container and another container or the host system that generates or holds the Nginx logs. This setup ensures that when Nginx logs are written to this shared volume (on a path accessible to both the Nginx container/host and the Logstash container), Logstash can access and process these logs from its designated path. -
Flexibility and Configuration: The path
/usr/share/logstash/logs/nginx-access.logis an arbitrary choice made for demonstration. In practice, you can configure this path based on your specific deployment needs and how you set up your volumes in Kubernetes. The key is to ensure consistency between where your logs are written to and where Logstash expects to find them. -
Simplifying Log Management: By centralizing logs from various sources to a specific directory that Logstash monitors, you simplify log management. Logstash continuously watches this directory for new or updated log files to process, transforming and forwarding them to Elasticsearch or another destination as configured.
In summary, the path /usr/share/logstash/logs/nginx-access.log is a convention used within the Logstash container's filesystem, aligning with how volumes are mounted and shared in Kubernetes, to facilitate efficient log processing in a containerized environment.
When you have multiple pods within a Kubernetes cluster generating logs, managing and processing these logs efficiently becomes a key concern. Logstash, deployed within the cluster, can still aggregate and process logs from all these pods, but the setup becomes slightly more complex to ensure all logs are collected. Here’s an approach to handle this scenario:
Using a Sidecar Container for Log Collection
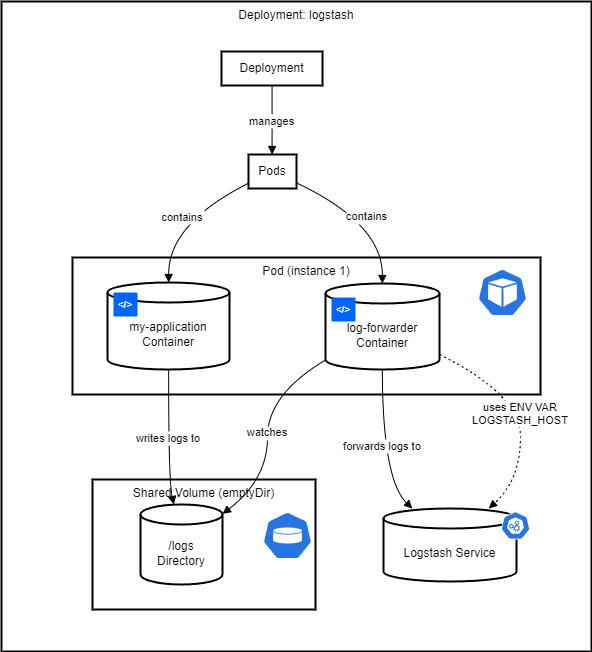
A common pattern for collecting logs from multiple pods is to use a sidecar container. This container runs alongside your application container within the same pod and is responsible for collecting logs from the application container and forwarding them to Logstash. The sidecar container can tail log files from a shared volume or capture stdout/stderr streams.
Steps to Aggregate Logs from Multiple Pods
-
Centralized Logging Volume: Configure each pod to write logs to a shared volume. This could be an
emptyDirvolume if temporary storage is sufficient, or a more persistent storage solution if needed. -
Sidecar Container: Deploy a sidecar container in each pod that has the sole purpose of forwarding logs. This container could use tools like
fluentd,filebeat, or a simple custom script that tails log files and sends them to Logstash. -
Logstash Configuration: Configure Logstash to listen for incoming logs from these sidecar containers. Depending on how you set up the sidecar, Logstash might listen over a network protocol (e.g., HTTP or TCP) or process files from a shared volume if running as a DaemonSet within the cluster.
-
DaemonSet Deployment for Logstash: Alternatively, Logstash can be deployed as a DaemonSet. This ensures that a Logstash instance is running on every node, allowing it to collect logs from sidecar containers across the cluster more efficiently. Each Logstash instance would then forward the processed logs to a centralized Elasticsearch cluster.
Example Configuration for a Sidecar Approach
Deployment YAML for an Application Pod with a Logging Sidecar
apiVersion: apps/v1
kind: Deployment
metadata:
  name: my-application
spec:
  replicas: 3
  selector:
    matchLabels:
      app: my-application
  template:
    metadata:
      labels:
        app: my-application
    spec:
      containers:
        - name: my-application
          image: my-application-image
          volumeMounts:
            - name: log-volume
              mountPath: /var/log/my-application
        - name: log-forwarder
          image: log-forwarder-image
          env:
            - name: LOGSTASH_HOST
              value: "logstash-service"
          volumeMounts:
            - name: log-volume
              mountPath: /var/log/my-application
      volumes:
        - name: log-volume
          emptyDir: {}
This deployment includes an application container and a log-forwarding sidecar container. Both containers mount the same volume where the application writes its logs. The sidecar container is responsible for forwarding these logs to Logstash.
Logstash Configuration to Receive Logs
Depending on the sidecar's mechanism (e.g., HTTP or TCP), Logstash’s input configuration needs to match this. For a TCP input from a sidecar container that forwards logs over TCP, the configuration might look like:
input {
  tcp {
    port => 5000
  }
}
Ensure the Logstash service within Kubernetes is accessible to the sidecar containers, possibly using a Kubernetes Service of type ClusterIP.
Log Forwarder
The implementation of a log forwarder in a Kubernetes environment, particularly when used as a sidecar container, involves capturing logs from the application within the same pod and forwarding them to a centralized logging system like Logstash. A log forwarder typically focuses on efficient log collection, optional processing (like adding metadata), and reliable transmission of logs. Here's an overview of how you can implement a log forwarder, with examples using Filebeat and a custom script approach:

Using Filebeat as a Log Forwarder
Filebeat is a lightweight, open-source shipper for log file data. As part of the Elastic Stack, it's designed to forward logs to Elasticsearch or Logstash while providing backpressure-sensitive protocols to handle large volumes of data.
-
Filebeat Configuration: Configure Filebeat to watch for log files in a specific directory (which your application writes to) and forward them to Logstash.
-
Deployment: Deploy Filebeat as a sidecar container in your application pods.
Example: Filebeat Sidecar Configuration
apiVersion: apps/v1
kind: Deployment
metadata:
  name: my-application-with-filebeat
spec:
  replicas: 1
  selector:
    matchLabels:
      app: my-application
  template:
    metadata:
      labels:
        app: my-application
    spec:
      containers:
      - name: my-application
        image: my-application-image
        volumeMounts:
        - name: log-volume
          mountPath: /var/log/my-app
      - name: filebeat-sidecar
        image: docker.elastic.co/beats/filebeat:7.9.3
        args: [
          "-c", "/etc/filebeat.yml",
          "-e",
        ]
        volumeMounts:
        - name: log-volume
          mountPath: /var/log/my-app
        - name: config-volume
          mountPath: /etc/filebeat.yml
          subPath: filebeat.yml
      volumes:
      - name: log-volume
        emptyDir: {}
      - name: config-volume
        configMap:
          name: filebeat-config
This configuration assumes you have a ConfigMap named filebeat-config with your Filebeat configuration pointing to Logstash.
Custom Script as a Log Forwarder
For simpler use cases or when you have specific forwarding needs, a custom script can be written and deployed as a sidecar container. This script can tail log files and forward them to Logstash.
-
Script Implementation: Implement a script in a language of your choice (e.g., Python, Bash) that tails a log file and sends each new line to Logstash.
-
Deployment: Deploy this script as a sidecar container in your application pods, similar to the Filebeat example.
Example: Custom Script Sidecar
#!/bin/bash

# Tail logs from a specific file and forward to Logstash
tail -F /var/log/my-app/application.log | while read line
do
  # Example: Forwarding to Logstash using netcat
  echo "$line" | nc logstash-service 5000
done
This simplistic script reads new lines from the application's log file and forwards them to Logstash using netcat. The actual implementation can be more complex, based on your needs (e.g., handling multiline logs, adding metadata).
Conclusion
Deploying Logstash in Kubernetes allows you to efficiently manage logs across your cluster. By tailoring the input, filter, and output configurations, you can adapt Logstash to meet the specific needs of your Kubernetes environment, ensuring that your logging infrastructure is as dynamic and scalable as your containerized applications.
